Wednesday, 30 Nov 2022
At the School Engagement team's last webinar for 2022, Research Fellow Charlotte Waters and Senior Research Fellow Dara Ramalingam delved into ACER’s learning progressions and their uses, and also looked at how they relate to PAT. Here are a few key insights from that discussion.
What is a learning progression?
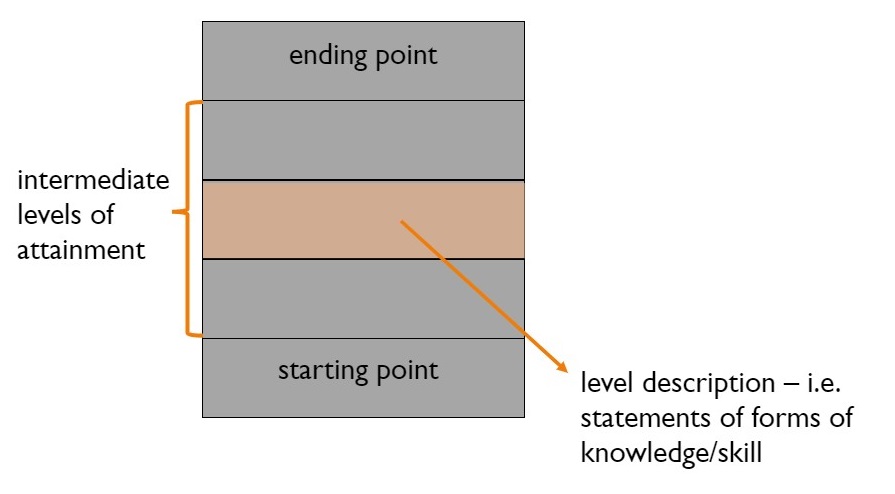
Every learning progression has a starting point, an ending point and some number of intermediate points.

Figure 1: Some features found in all learning progressions.
Yet, they are not all the same. They can describe something very broad (such as mathematics) or something very narrow (such as measuring length). They may or may not be divided into sub-areas or strands. They can cover progression over different time scales, have variations in the transitions between adjacent levels, or have different qualities in the level descriptions.
Figure 2: How and where learning progressions can differentiate from each other.
Ms Waters further explained that the features and characteristics of learning progressions interact, resulting in different suitability in their application. This is demonstrated in her examples below.
Figure 3: An example of a learning progression.
The learning progression described in Figure 3 might be more appropriate for supporting teachers’ formative assessment practice and their day-to-day classroom planning and decision-making.
Figure 4: Another example of a learning progression.
The learning progression described in Figure 4 might be more appropriate for establishing high-level curriculum expectations, and for reporting results of summative assessment removed from the classroom context.
ACER learning progressions and their uses
ACER’s learning progressions for reading and mathematics aim to support education systems in becoming more coherent overall. The learning progressions are underpinned by a numerical scale, which comes from assessment data.
‘In each case, assessment data… [comes] from many, many different assessment programs, including national, regional, and large-scale assessments,’ Dr Ramalingam explained. ‘So there is a lot of different data underpinning that numerical scale and that allows that really robust representation of progress. The scale is quantitative representation of progress, but then we take that scale and we divide it into a number of levels.’
These levels each have four layers of qualitative descriptions and illustrations of what progress in the learning area typically looks like. Dr Ramalingam described how they are used in relation to the four main elements of education systems – summarised in the table below.
| Curriculum | Instruction | Assessment | Professional development | |
|---|---|---|---|---|
|
Domain layer This layer contains a definition of what it is that we are interested in and why it's important, and a general description about what developing proficiency looks like. |
Assists stakeholders in considering the learning areas that should feature in curricula. | Gives the scaffolding in assessment by providing the construct definition. | Is a resource for enriching teachers’ understanding of the essential nature and value of the learning areas they teach. | |
|
Levels layer This layer provides broad descriptions of each of the levels that students move through, irrespective of age or grade. |
Suggests appropriate wording for high-level curriculum expectations. | Is useful for reporting results of assessments that have been undertaken for summative purposes. | Together, the Levels, Strands and Illustrations layers can be a resource to enrich teachers’ understandings of typical sequences of progress in learning and common barriers to it. | |
|
The Levels and Strands layers demonstrate how curricula can reflect research on learning progress. Any student of any age or grade can be at any level – a useful tool for tackling diversity.
|
||||
|
Strands layer This layer features more detailed and specific descriptions of growth indicators and essential skills. |
Is useful for guiding and facilitating instruction that will cater to a range of abilities.
|
Helps with developing and selecting formative assessment tasks. |
||
| Allows teachers to give transparent feedback to students. | ||||
|
The Strands and Illustrations layers inform the development of assessment items that link directly to different aspects of the strands, and that could look like.
|
||||
|
Illustrations layer This layer has examples of what it looks like for a student to be at a particular level, cementing the descriptions of growth in the other layers. |
Demonstrates what student work products and performance might imply about where they are in their learning attainment and progress. |
The relationship between ACER learning progressions and PAT
In developing ACER’s learning progressions, the PAT-described scales were one source of evidence. Ms Waters explained how it was taken beyond this, capturing the very essence of what it means for a student to be at a particular level. ‘We really want to show what is somewhat continuous across the levels and what changes across the levels to really emphasise what progress looks like’.
Building on this, ACER plans to make learning progressions the frames of reference for reporting the results of many assessments we develop and implement.
‘We are moving towards a situation,’ Ms Waters said, ‘where the rich, considered, consistent descriptions of ACER’s learning progressions and that underpinning numerical scale serve as the frame of reference for all assessments that ACER develops and implements within the same domain.’
Learn more
If you would like to hear the full discussion, you can access this webinar in your school account, or by requesting a copy from the School Engagement team at school.engagement@acer.org.
You can also access ACER’s Learning Progression Explorer at https://learning-progression-explorer.acer.org/.
